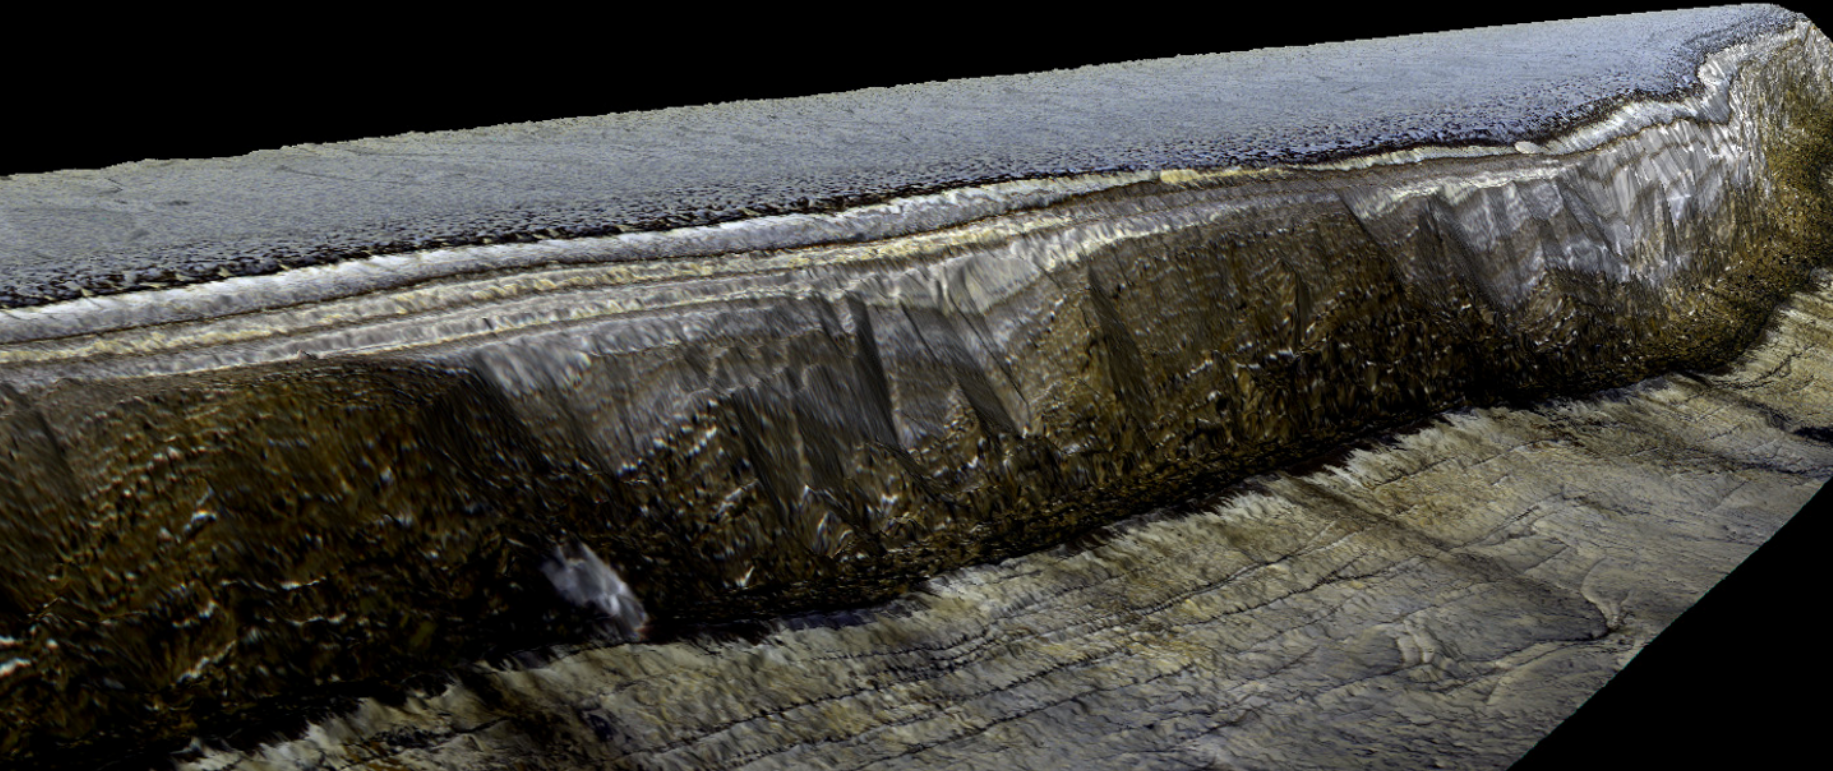
This first image was derived from the DEM raster. A DEM is a grid of numbers, who's size is based on resolution, with each number detailing the elevation. In this image we can see that there is a smoothness to the terrain on the top and large rugged rock on the bottom.
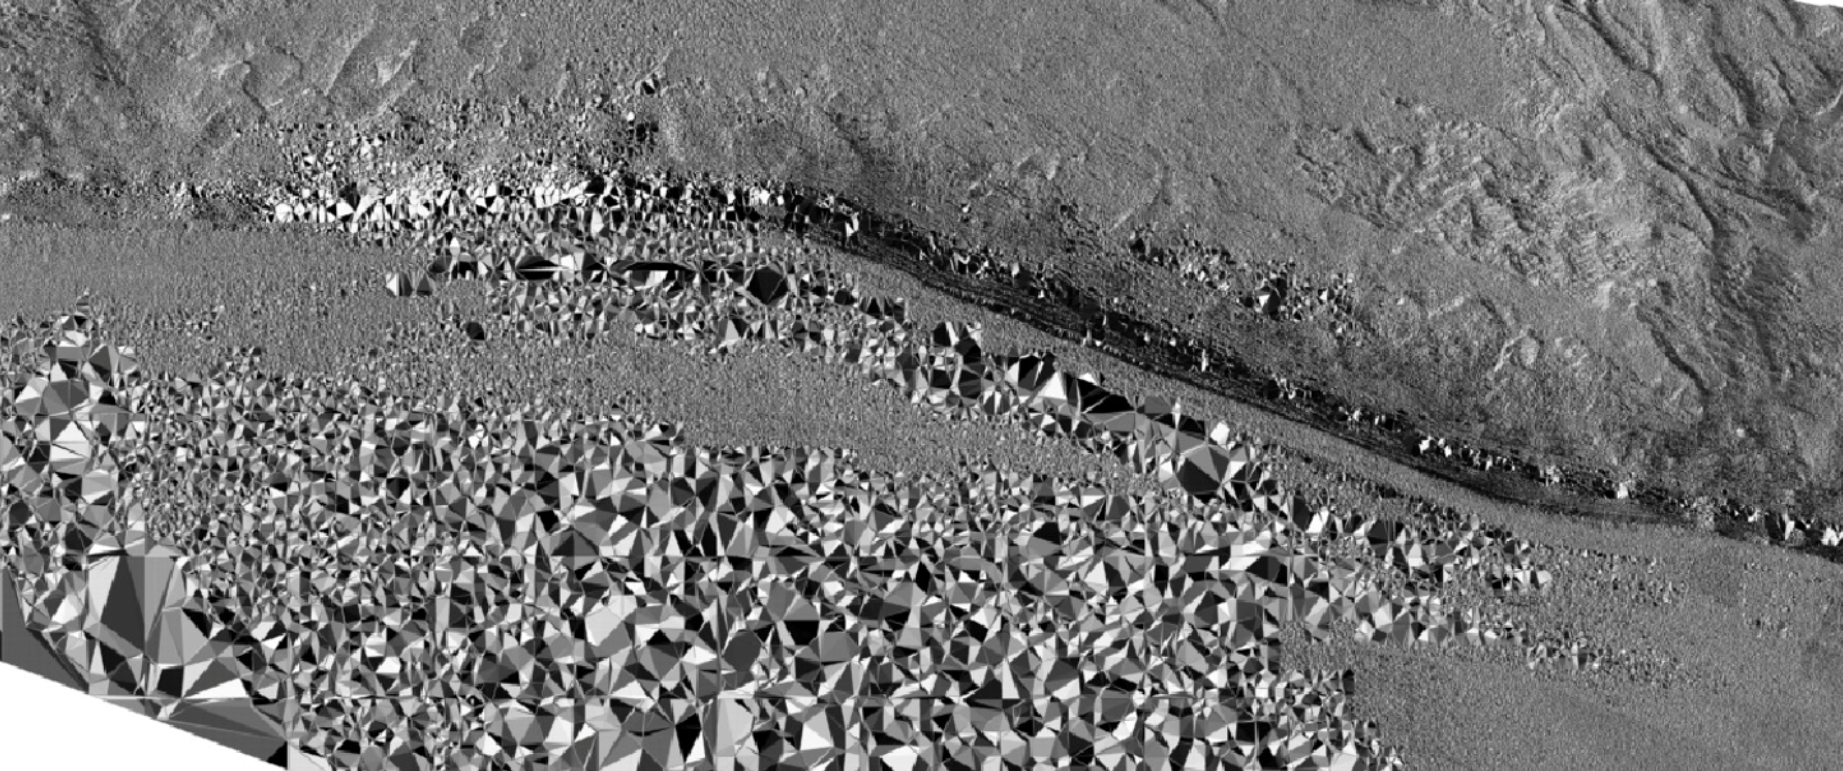
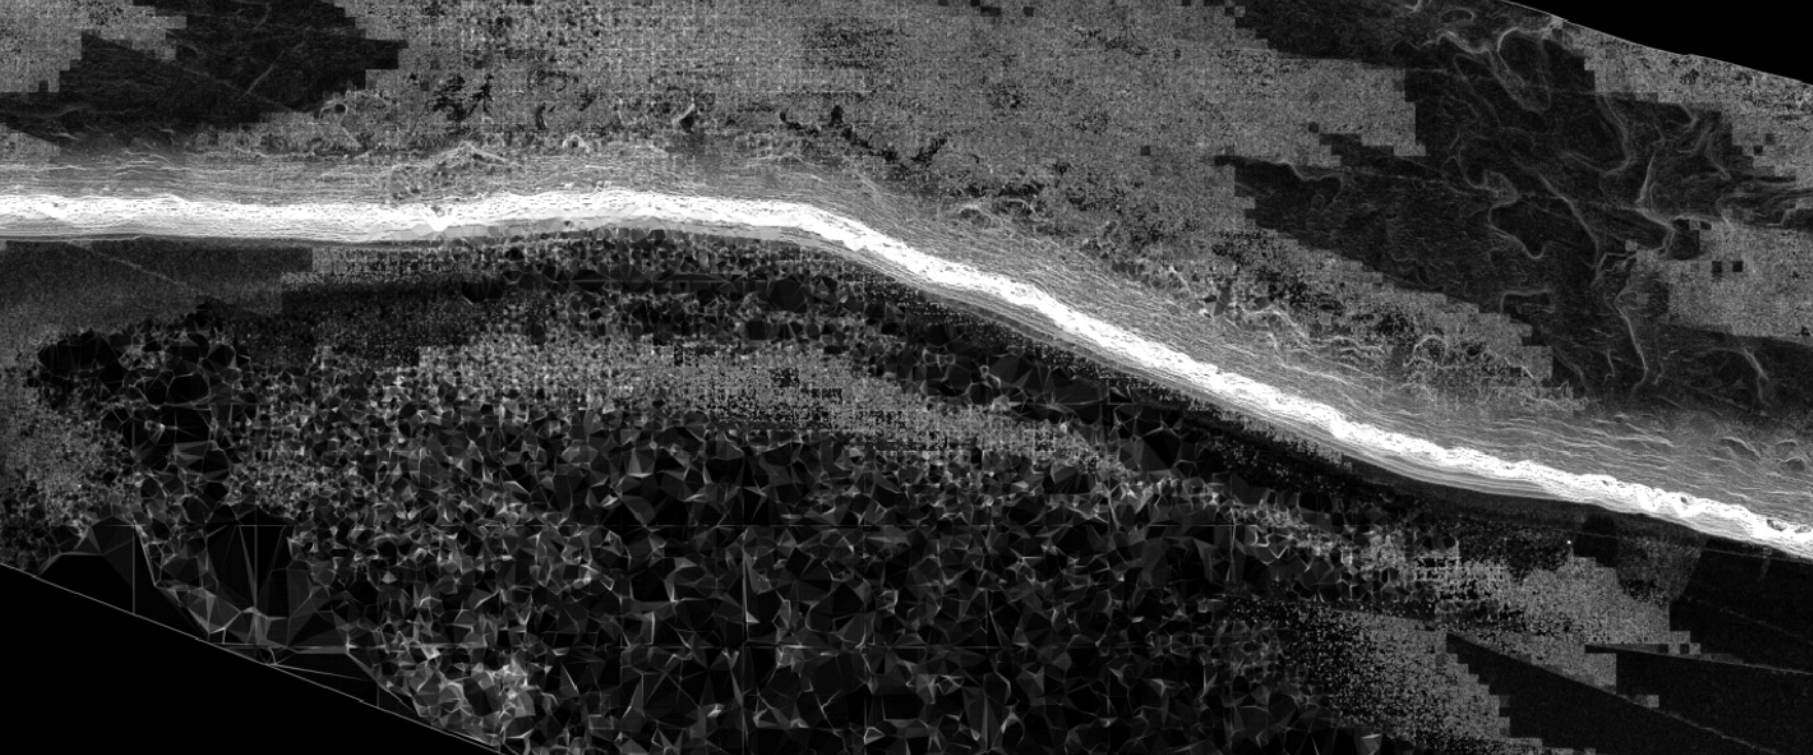
The next image is a slope analysis, it indicates slope from black to white. Black indicates that there is little slope or change in elevation, while white indicates steep slope. Immediately we can see that there is a drastic change in elevation signified by the white line running across the image from left to right.
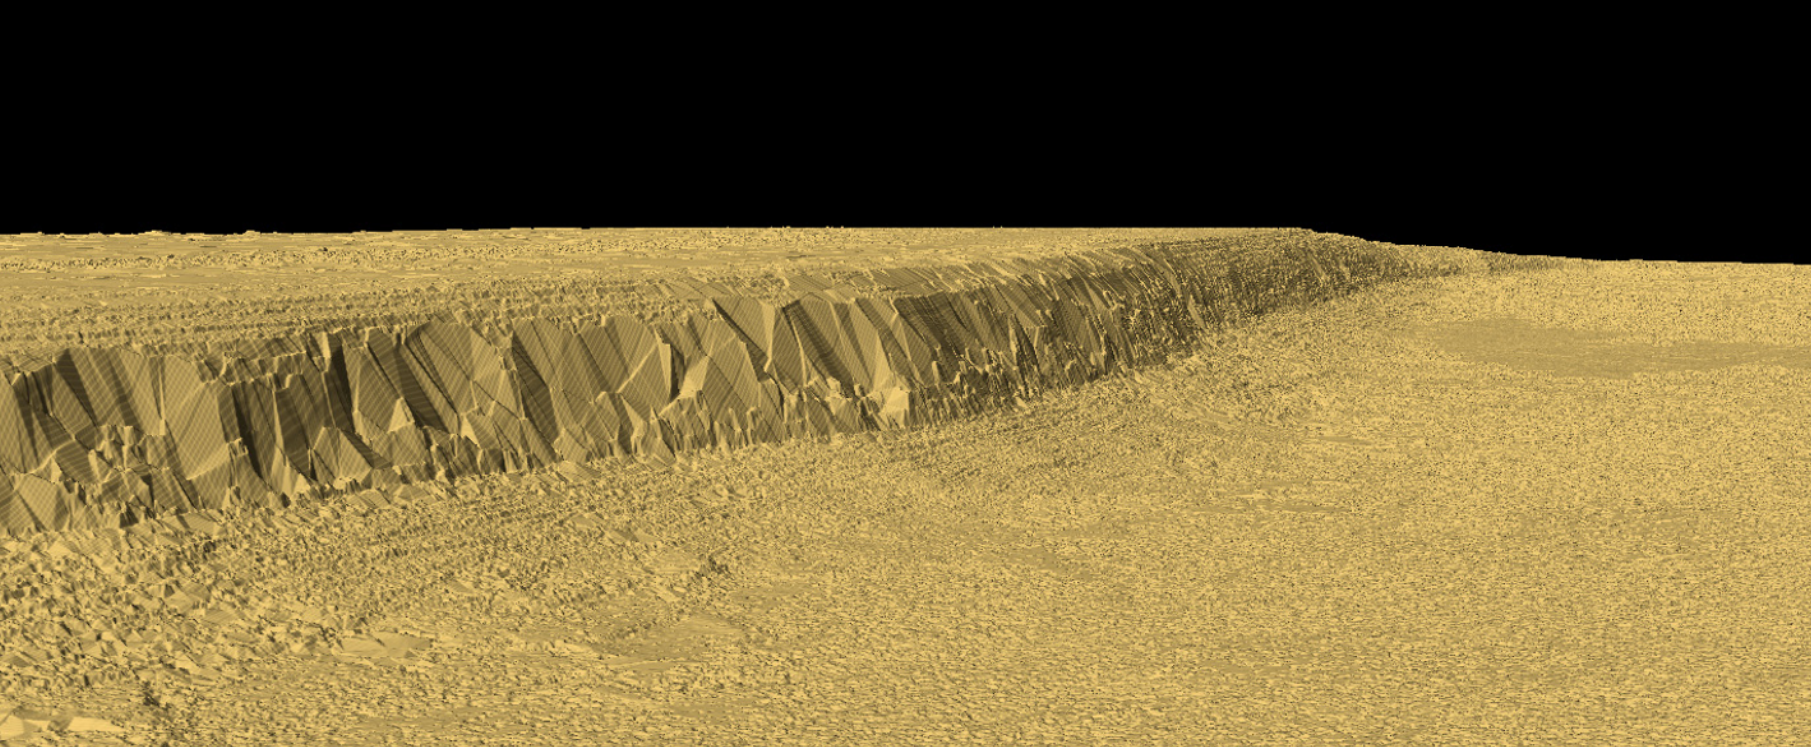
The sharp slope indicated by the previous image shows that there could be terrain features worth investigating. A 3D image was created using the same DEM used to create the previous 2 images.
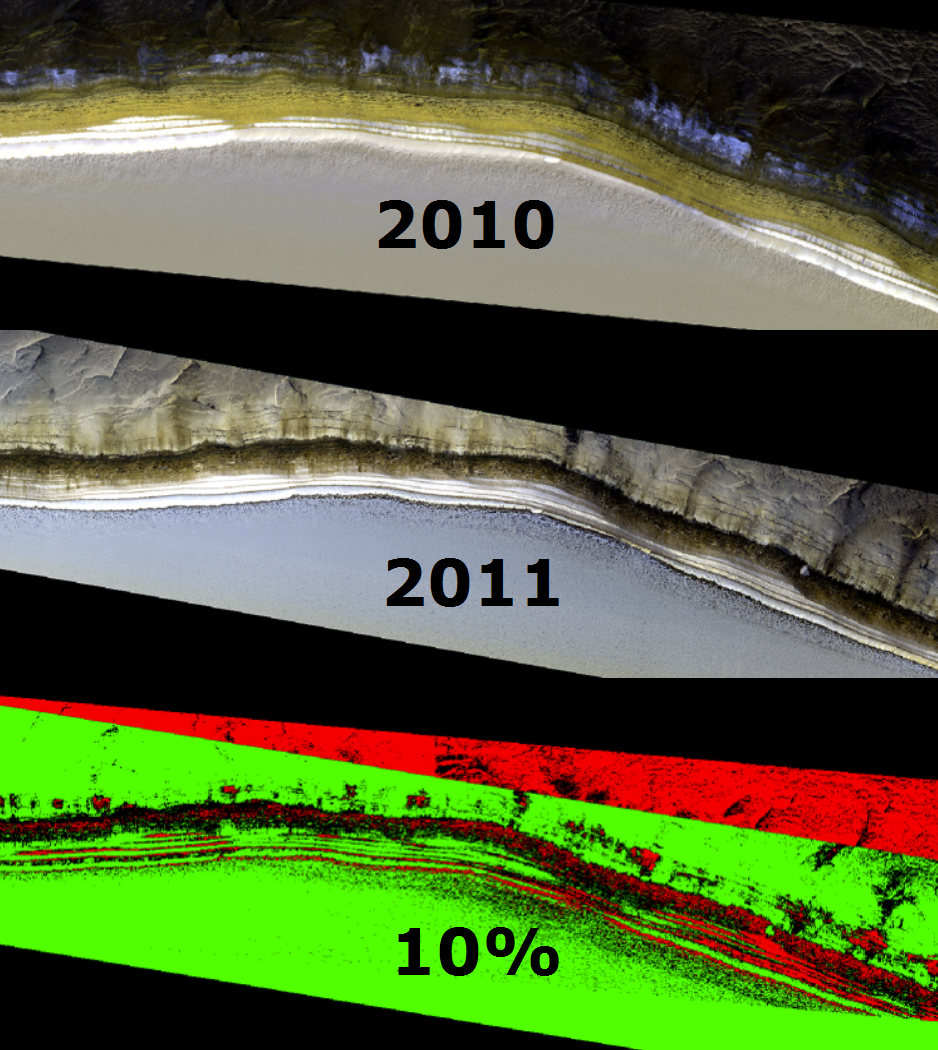
The following images were used to detect change in snow accumulation. Images from 2010 and 2011 that were almost exactly one martian year apart were used. Different tolerance thresholds were used to find the truest change detection of the snow. This image shows in green where snow had accumulated and the red indicates the loss of snow.
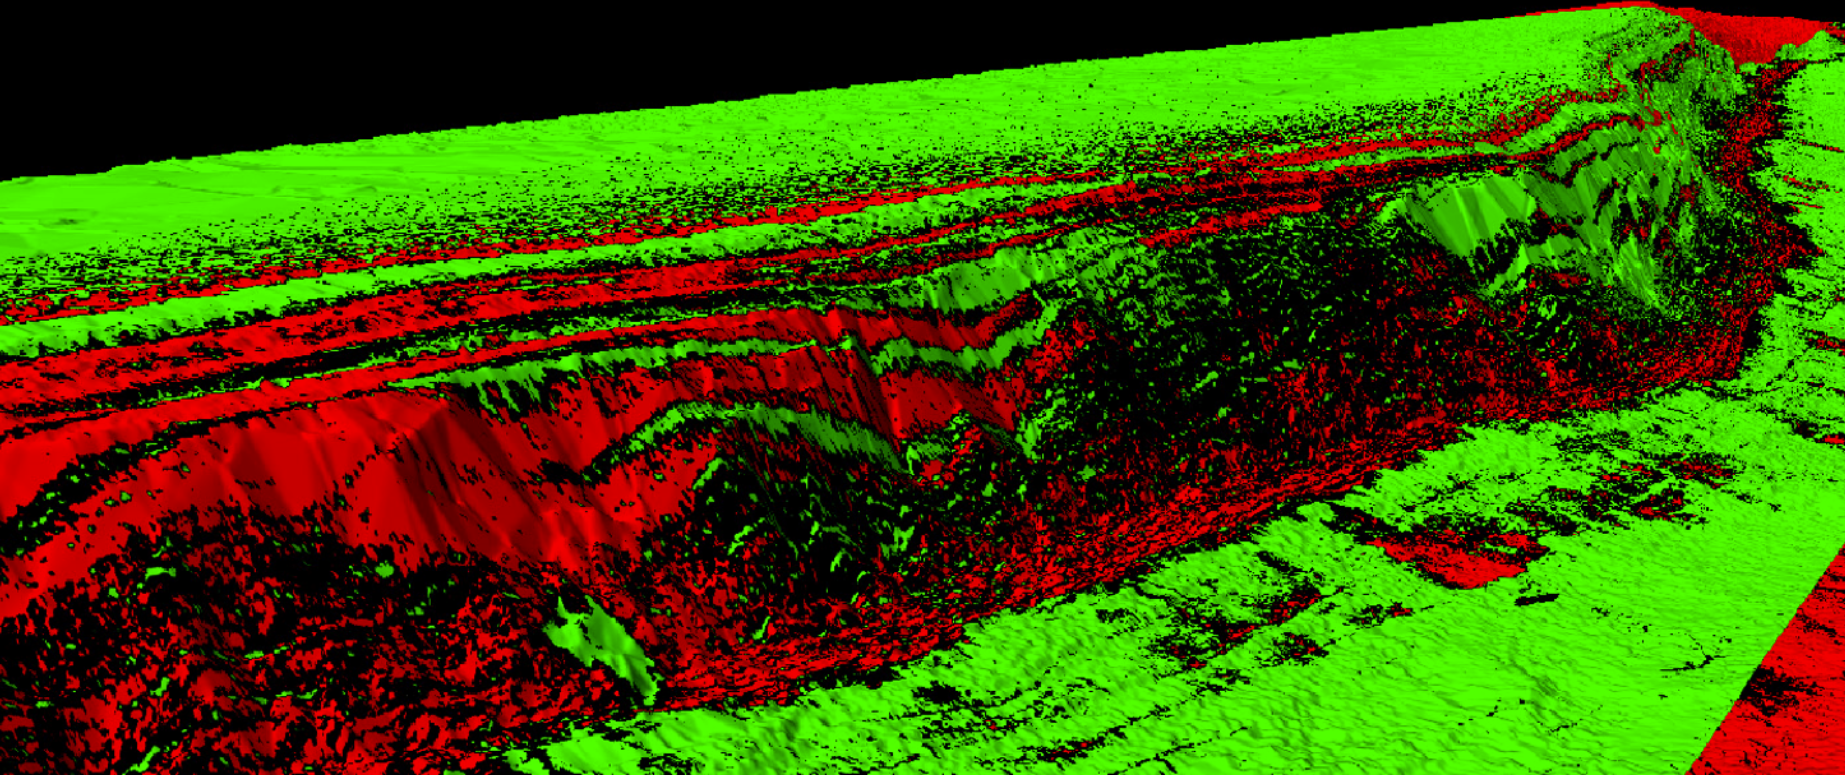
Draping this change detection over the 3D image gave me a very good visualization of the change in snow between the 2010 and 2011 images.
2010 image drape
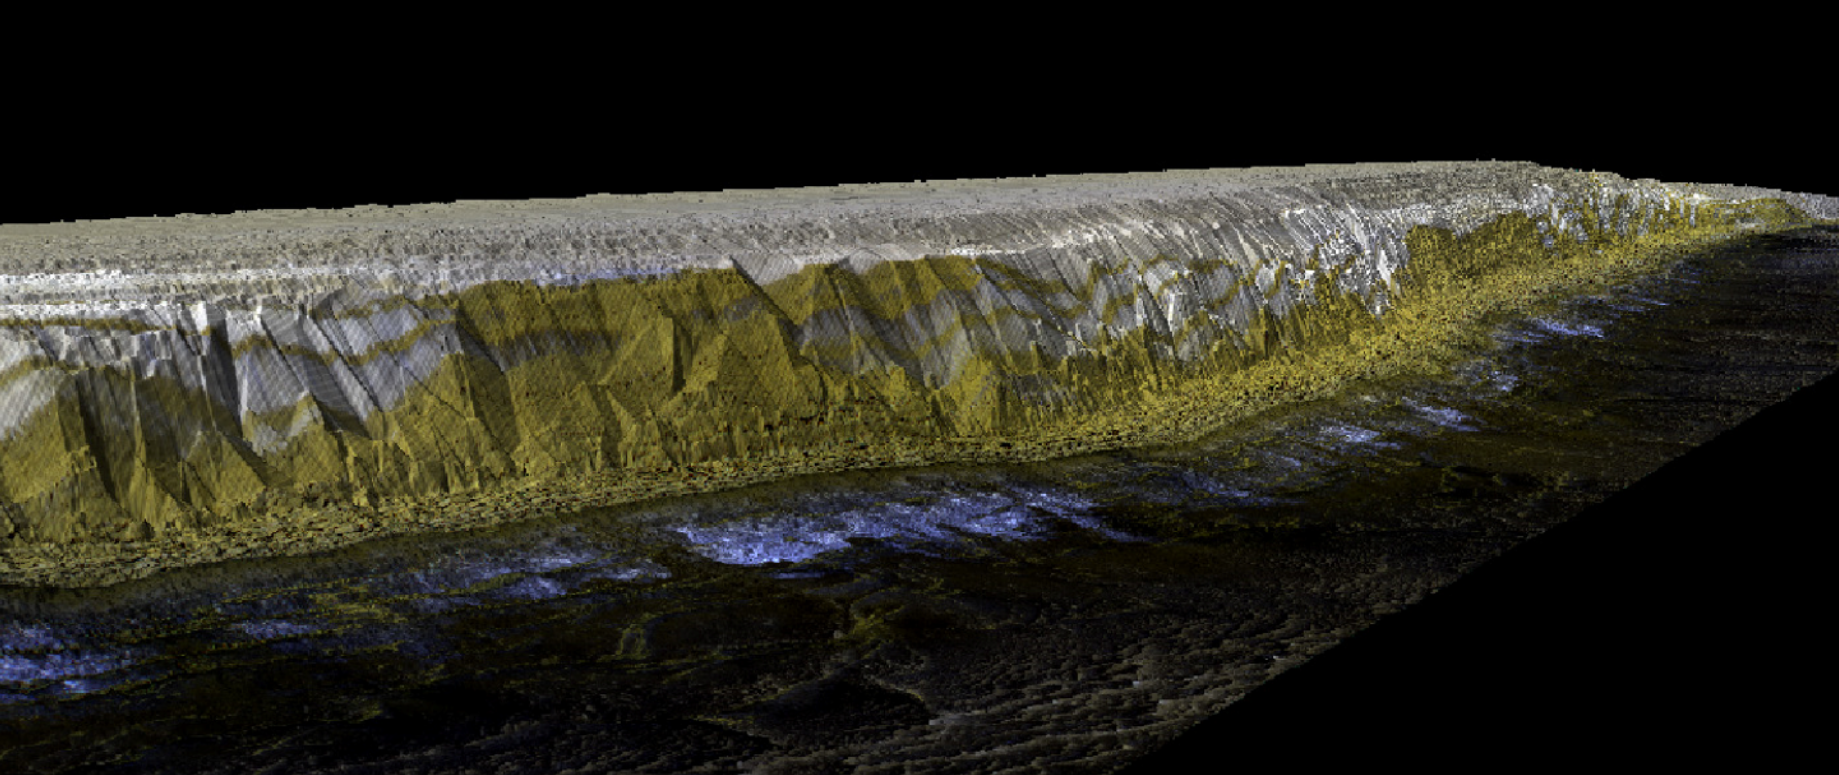
2011 image drape, notice the falling snow at the center left bottom of the image. Perhaps this area has high avalanche activity for such an event to be captured.